🔬 Quantitative Finance Research

Testing the Random Walk
Hypothesis on Bitcoin

A rigorous statistical analysis across 13 years of BTC-USD daily data using ADF, Autocorrelation, Runs Test, Variance Ratio, and GARCH(1,1) modelling.

📄 Read Full Report ⭐ View on GitHub

RWH REJECTED — 2 of 5 tests support the Random Walk Hypothesis

Bitcoin exhibits significant momentum, serial autocorrelation at 6–30 day horizons, and long-run variance ratio deviations — all inconsistent with a pure random walk. Bitcoin is not weak-form efficient.

Live BTC Price
Loading…
24h Change
Market Cap
24h Volume
via CoinGecko

Test Results — BTC-USD (2013–2026)

4,735 daily log return observations · April 2013 → April 2026

ADF Test — Prices

✔ Supports
p = 0.7450
Unit root present. Prices are non-stationary — consistent with a random walk structure.

ADF Test — Returns

✔ Supports
p = 0.0000
Log returns are strongly stationary. No unit root in the return series.

Ljung-Box ACF

✘ Rejects
Sig. lags 6–30
Significant autocorrelation beyond 1 trading week. Returns are serially dependent.

Runs Test

✘ Rejects
Z=3.04 · p=0.0024
Positive Z → fewer runs than expected → momentum clustering of same-sign returns.

Variance Ratio k=20

✘ Rejects
VR = 1.2273
VR > 1 at 20-day horizon. Positive autocorrelation — variance grows faster than linear.

Horizon k VR(k) z-statistic Significant? Interpretation
20.9902-0.677No ✔Near-random at 2-day
50.9990-0.030No ✔Near-random at 1-week
101.07471.523No ✔Borderline at 2-week
201.22733.147Yes ✘Momentum at 1-month
301.32103.582Yes ✘Strong momentum at 6-week

Diagnostic Charts

Publication-quality plots generated from the full BTC-USD dataset.

EDA Plots

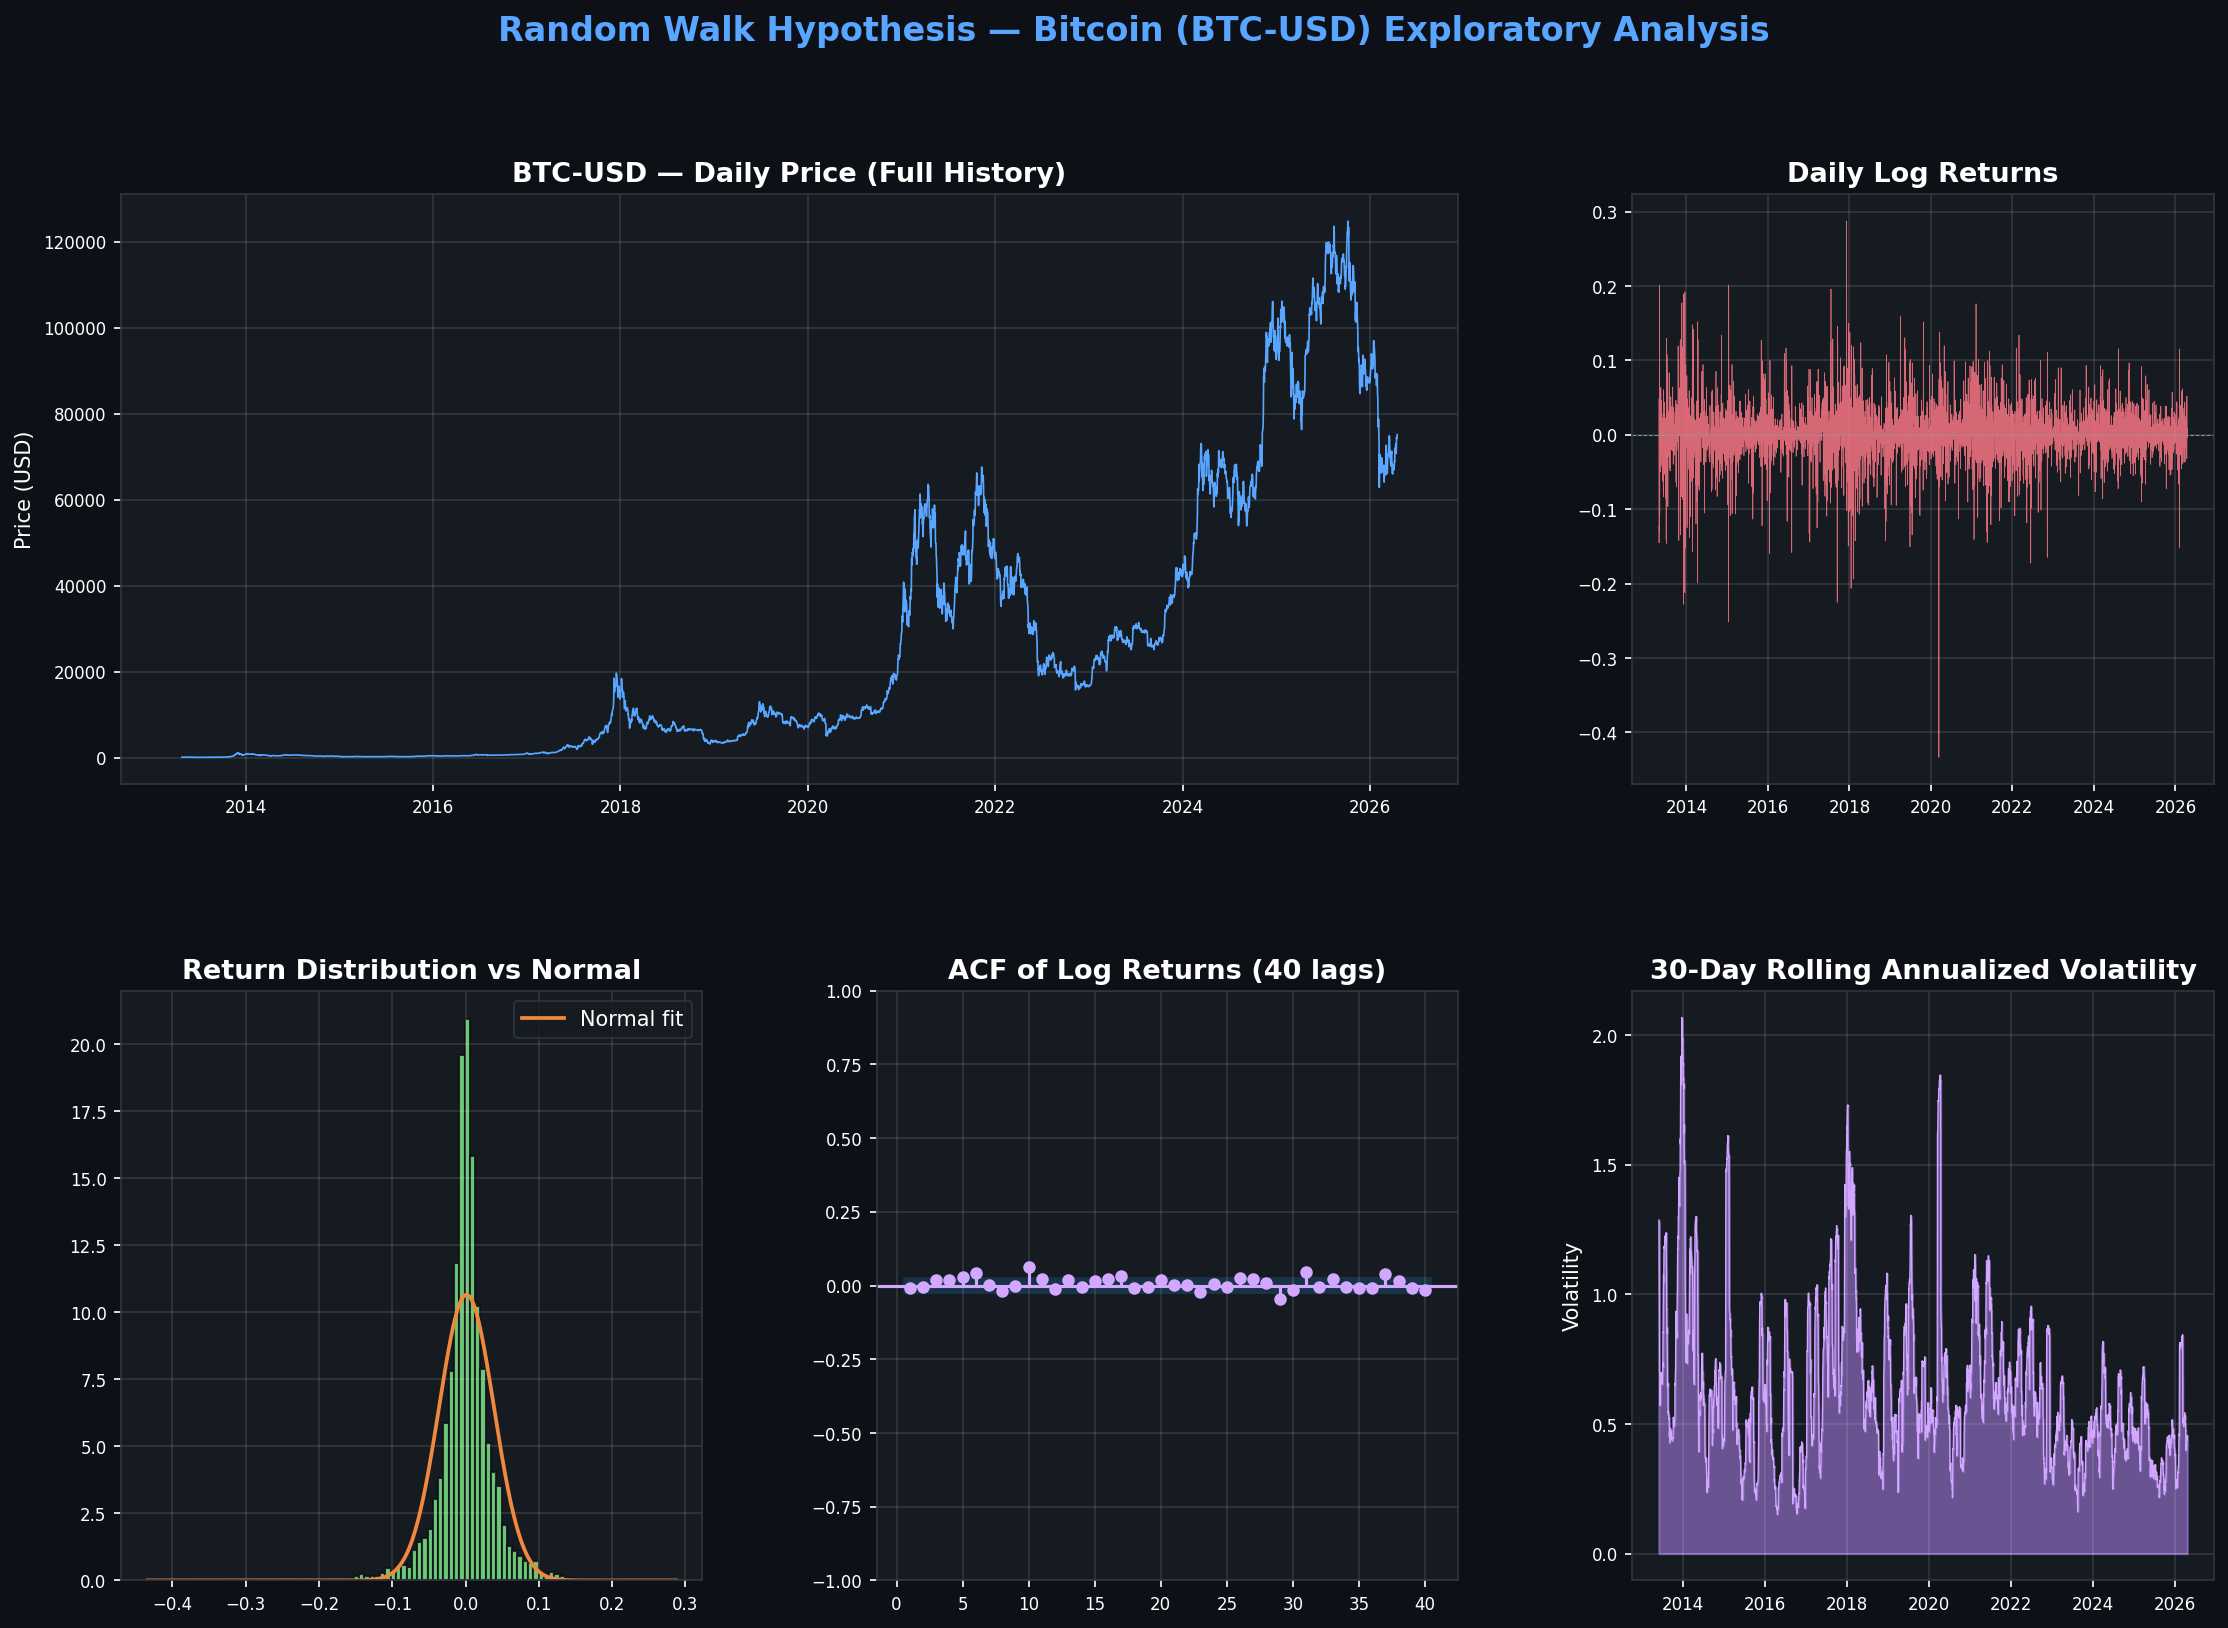
Exploratory Data Analysis

Price series, log returns, return histogram, ACF, and 30-day rolling volatility.

Variance Ratio

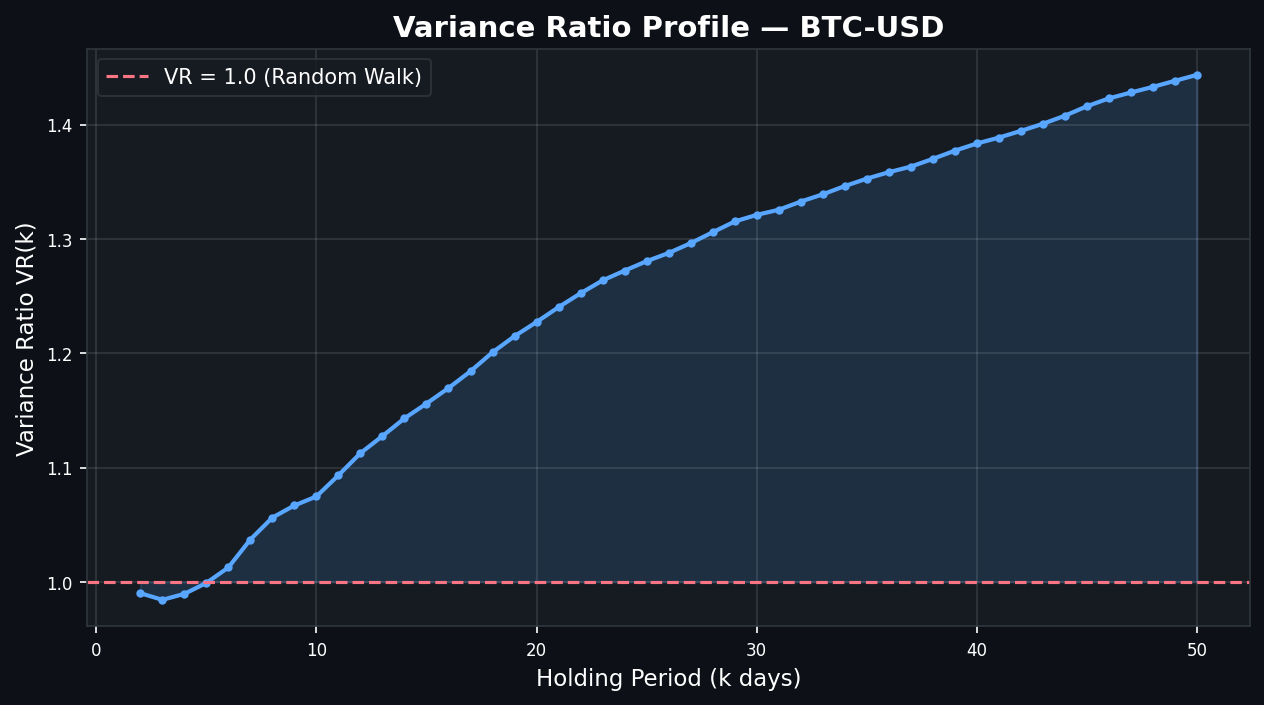
Variance Ratio Profile

VR(k) from k=2 to k=50. Monotonically rising curve confirms long-run momentum.

GARCH Plots

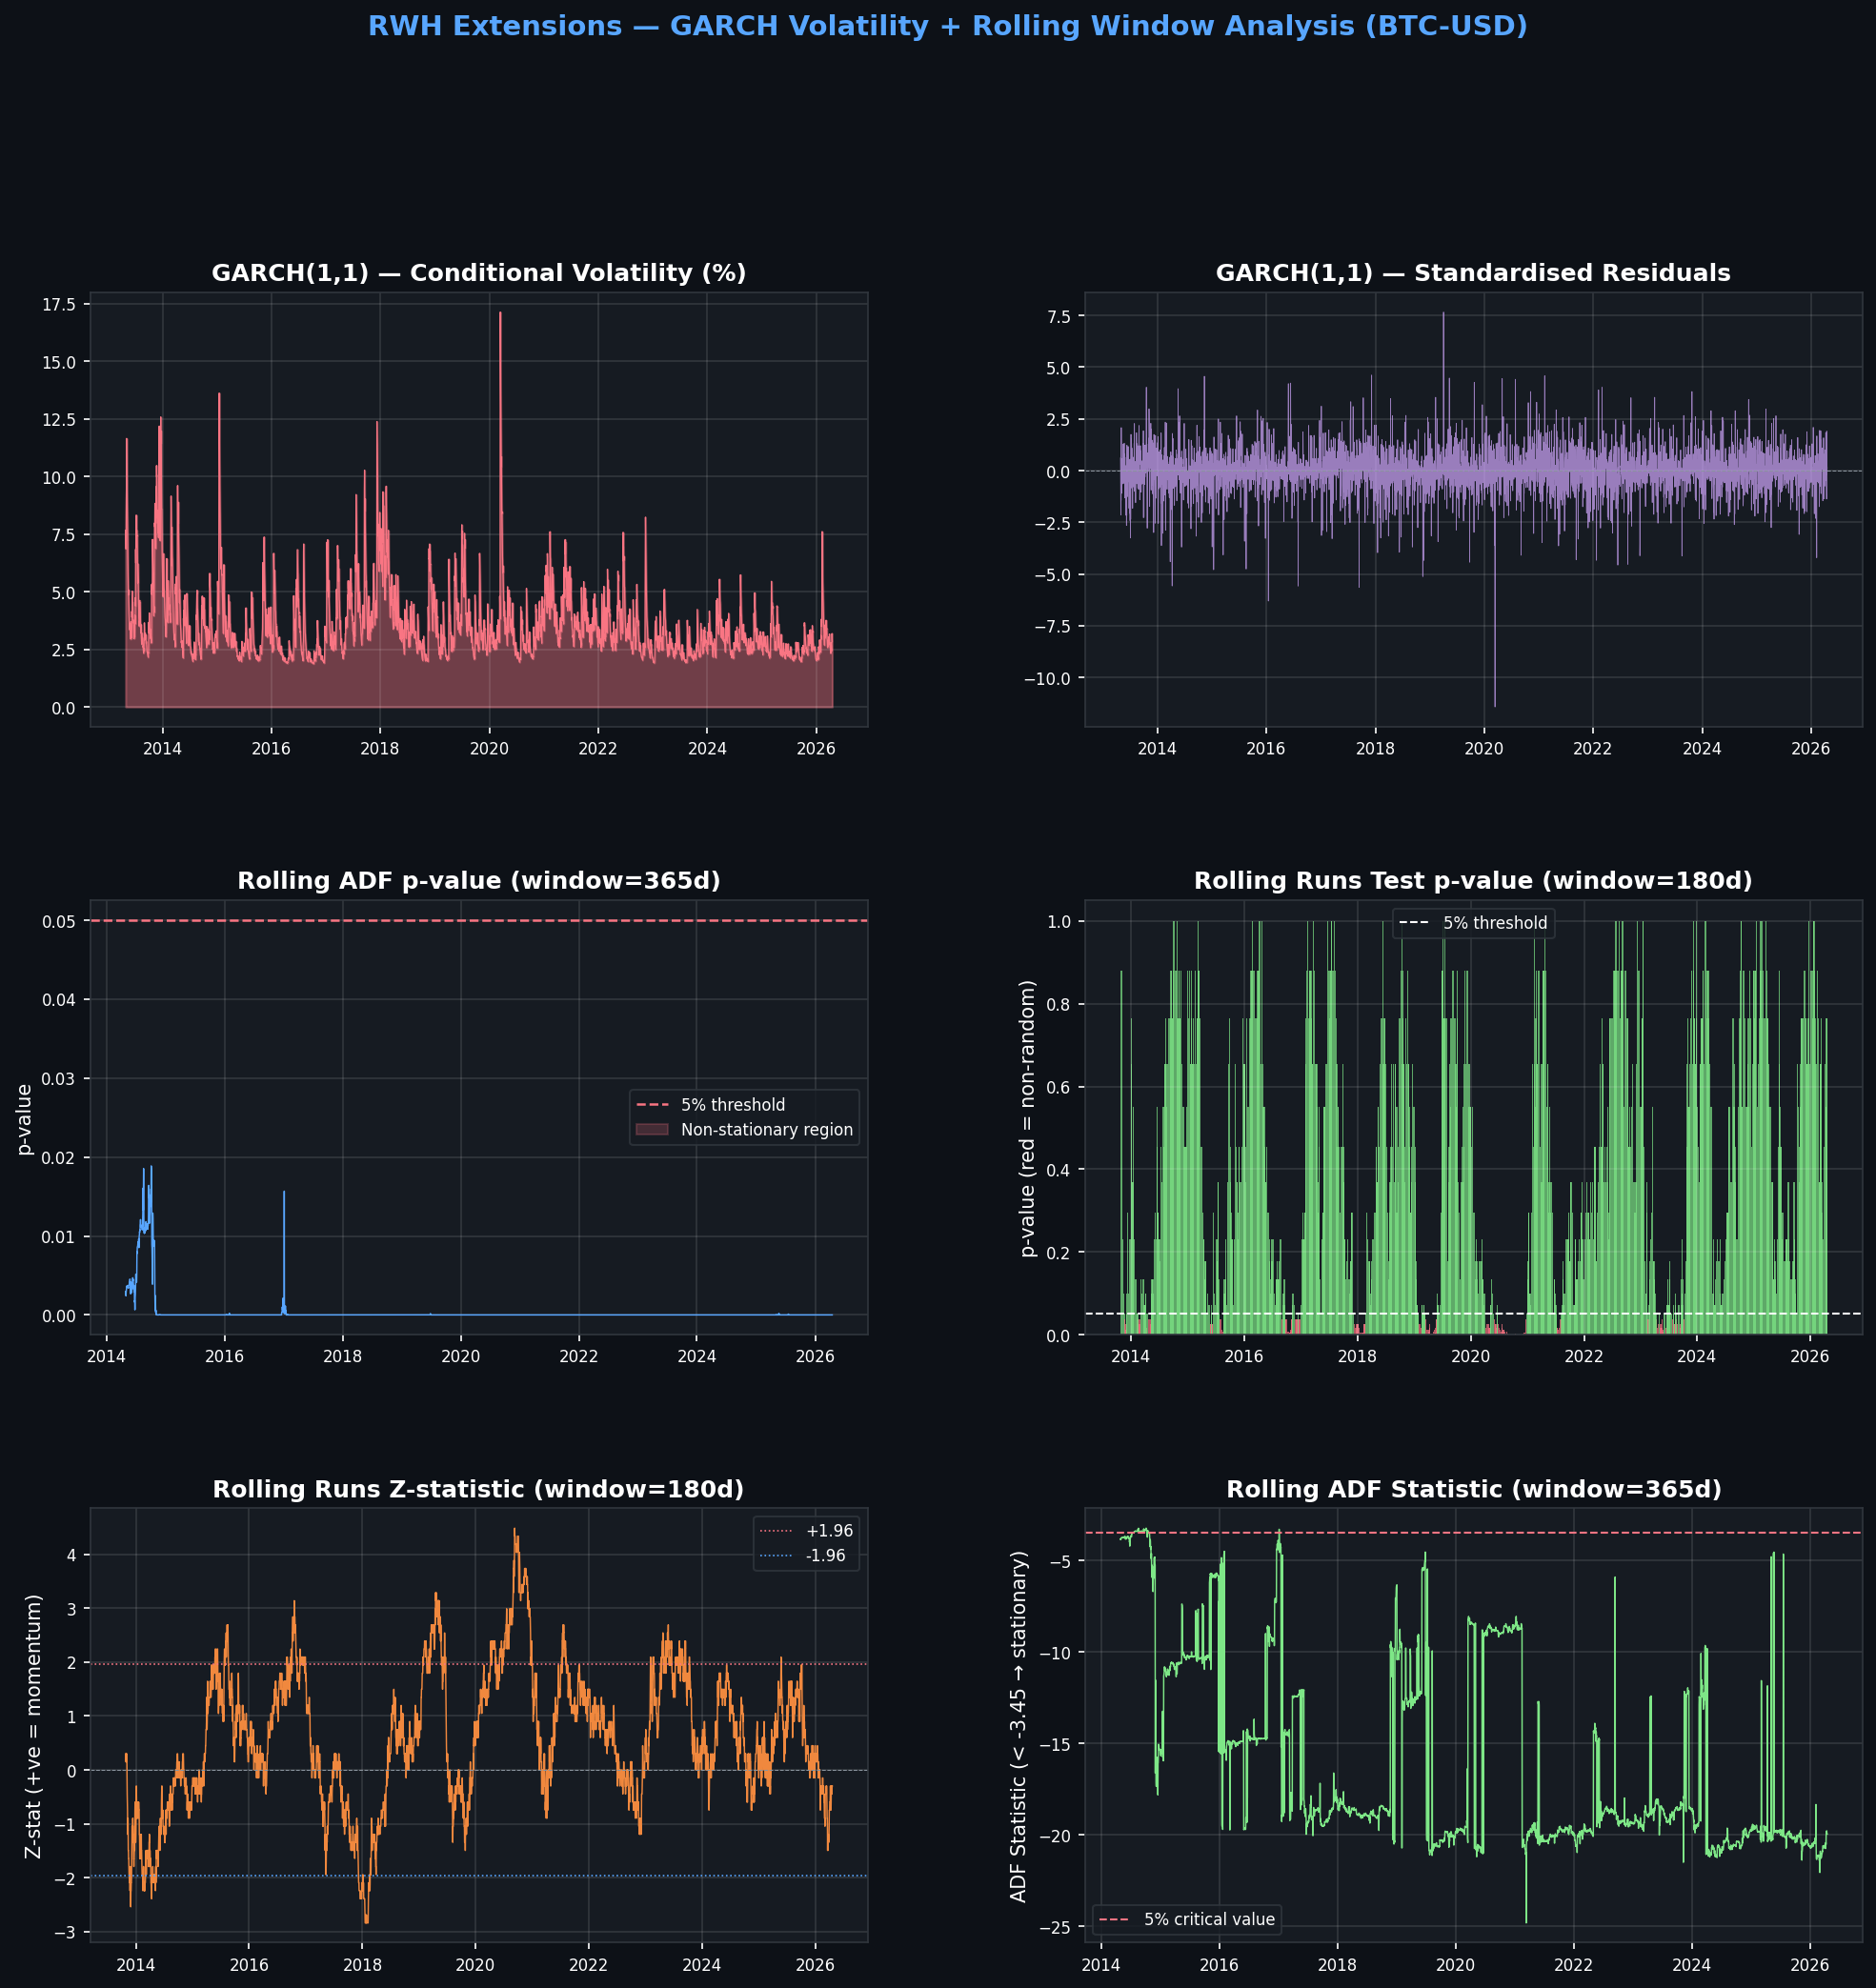
GARCH + Rolling Window Analysis

Conditional volatility, standardised residuals, rolling ADF and Runs statistics.

GARCH(1,1) Volatility Model

Fitted on 4,735 daily BTC log return observations (×100 for numerical stability).

μ (mu)
0.1357
p = 0.0013 ★★
ω (omega)
0.5957
p = 0.0003 ★★★
α alpha[1]
0.1484
p < 0.0001 ★★★
β beta[1]
0.8207
p < 0.0001 ★★★
Persistence α+β
0.9691
Very high — shocks decay slowly
Long-run Annual Vol
83.84%
Annualised conditional vol

Research Pipeline

Step-by-step statistical workflow applied to the BTC-USD time series.

1. Data Loading & Preprocessing

btc-usd-max.csv (CoinGecko) · 4,736 rows · 2013-04-28 → 2026-04-17 · datetime index, sorted, NaN-dropped.

2. Log Return Calculation

r_t = ln(P_t / P_{t-1}) · 4,735 observations · Mean=0.13%/day · Kurtosis=9.38 (extreme fat tails).

3. Augmented Dickey-Fuller Test

Prices: p=0.7450 (non-stationary ✔) · Returns: p<0.0001 (stationary ✔) · Both support RWH structure.

4. Ljung-Box Autocorrelation Test

Significant serial correlation from lag 6 onward (Q=16.03, p=0.0136). Medium-horizon dependence detected.

5. Wald-Wolfowitz Runs Test

Z=3.04, p=0.0024 · Positive Z → fewer runs than expected → momentum clustering of same-sign returns.

6. Variance Ratio Test (Lo-MacKinlay 1988)

VR rises monotonically from 0.99 (k=2) to 1.44 (k=50). Statistically significant at k=20,30.

7. GARCH(1,1) + Rolling Window Extensions

Persistence α+β=0.969. Rolling ADF: 100% of 365-day windows stationary. Rolling Runs: 14.8% non-random.


pip install pandas numpy matplotlib statsmodels arch
python rw_btc_test.py     # Core tests
python rw_extensions.py   # GARCH + rolling analysis

random-walk-hypothesis bitcoin python statsmodels garch time-series-analysis market-efficiency quantitative-finance hypothesis-testing financial-analysis